

Appearance
The Analytics Dashboard
Guessing how your community is doing is exhausting. The Analytics report answers it with numbers: how many people joined, how much they posted, who is doing the talking, and which spaces are actually alive.
Everything lives on one screen, split into three tabs: Overview, Members, and Spaces.
Use Case: You are running a month-long campaign to spark more discussion. Set the date range to that month, watch the Posts and Comments numbers on the Overview tab, then check Top Members to see who responded to the push — and reward them.
How to Open Analytics
- Open your community portal and click Settings at the bottom of the left sidebar.
- In Portal Settings, scroll down to the Reports section.
- Click Analytics.
The page opens on the Overview tab, labeled Reports (Beta) at the top.
Filtering What You See
Two controls sit at the top-right of every tab and apply to everything below them:
- Select: a quick preset for the reporting period.
- Date range: a calendar picker for an exact start and end date.
The Spaces tab adds a third control, Select Space, so you can narrow the whole report down to a single space instead of the entire community.
💡 Tip: Most stat cards show a small green badge like
+65 %next to the number. That is the change compared with the previous period of the same length — so a 30-day range is compared against the 30 days before it. Widen or shorten the range and that comparison moves with it.
The Overview Tab
This is your community at a glance.
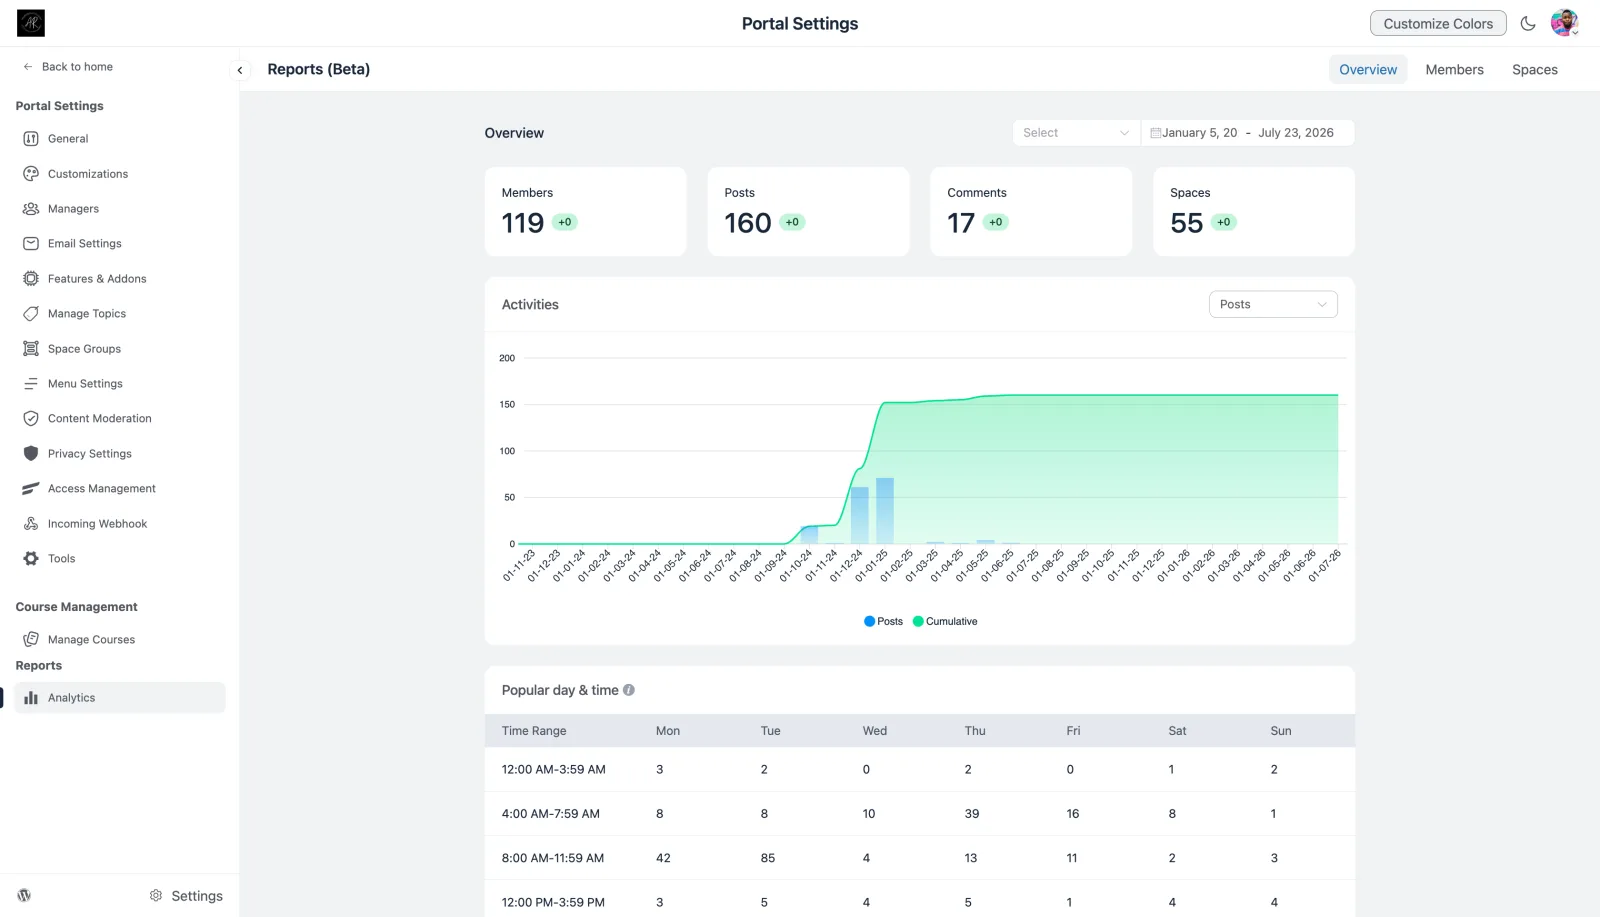
Stat cards. Four totals for the selected period — Members, Posts, Comments, and Spaces — each with its change badge.
Activities chart. A combined chart with a dropdown in its top-right corner so you can switch the metric being plotted (Posts, and other activity types). It draws two things at once:
- Bars: how much happened in each individual period.
- Cumulative line: the running total over time.
The bars tell you where the spikes were. The line tells you whether the community is still climbing or has flattened out.
Popular day & time. A grid of time blocks (12:00 AM–3:59 AM, 4:00 AM–7:59 AM, and so on) across Monday to Sunday, with the activity count in each cell. The heaviest cells are the hours your members are actually online — which is exactly when your announcements and new posts should go out.
The Members Tab
Everything about the people in your community.
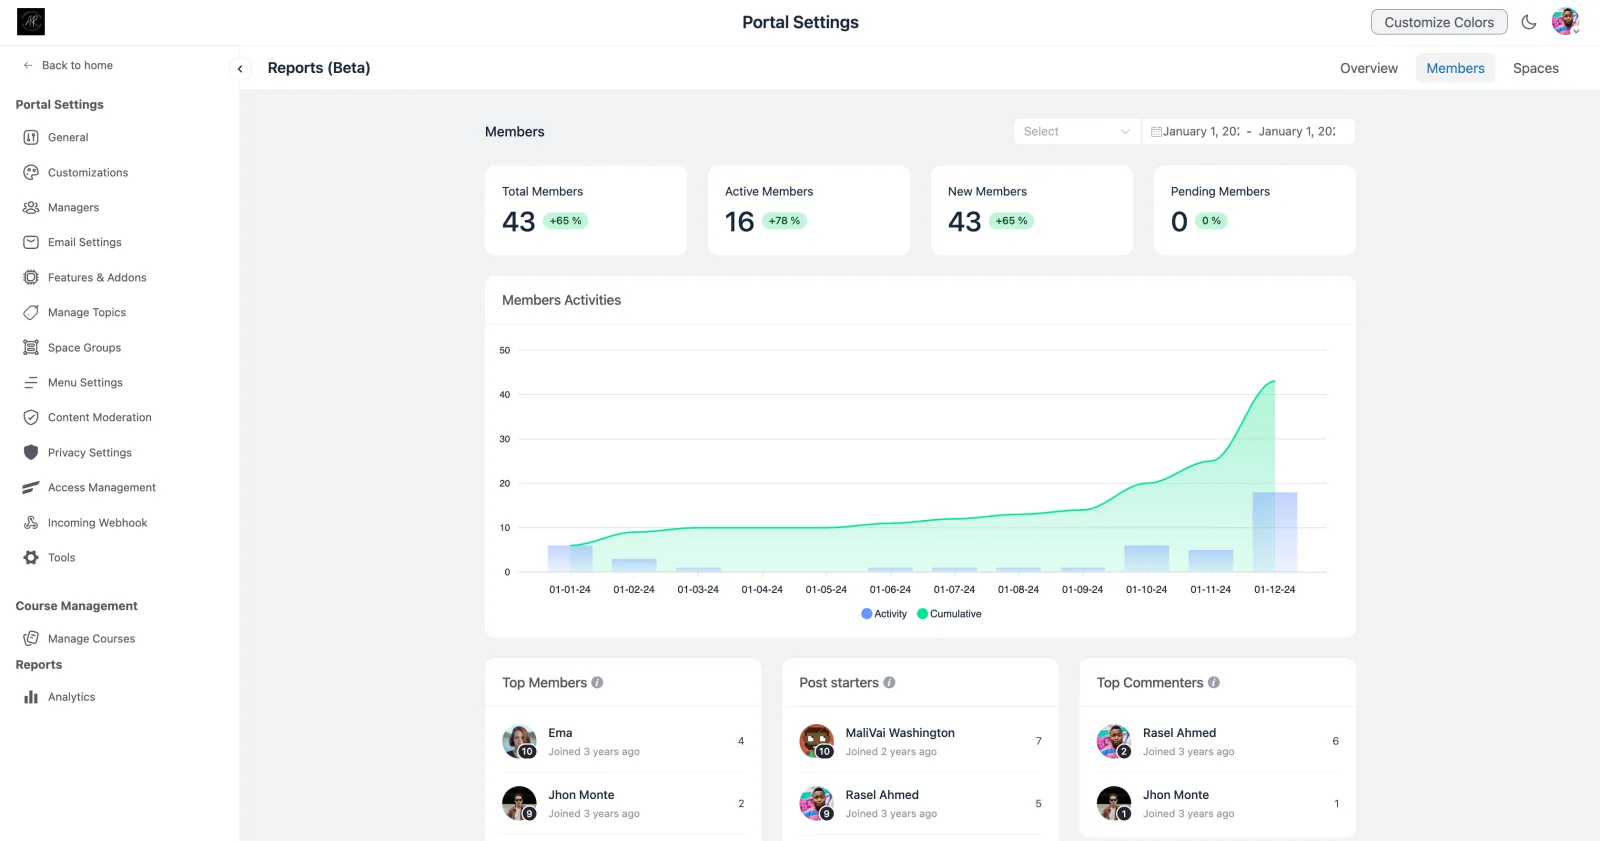
Stat cards:
| Card | What it counts |
|---|---|
| Total Members | Everyone in the community for the selected period. |
| Active Members | Members who actually did something — posted, commented, or reacted. |
| New Members | People who joined during the selected period. |
| Pending Members | Join requests waiting on your approval. |
Members Activities chart. Same shape as the Overview chart — bars for activity per period, a cumulative line for the running total — but scoped to member signups and member activity.
The three leaderboards at the bottom are the most useful part of this tab:
- Top Members: your most active people overall.
- Post starters: the members who begin conversations rather than just joining them.
- Top Commenters: the members who keep threads going.
Each row shows the member's avatar, name, how long ago they joined, and their count for that list.
✨ Note: Post starters and Top Commenters are two different kinds of valuable. Post starters generate the content; Top Commenters generate the replies that make a community feel busy. Look for names that appear in both — those are your best candidates for space managers or moderators.
The Spaces Tab
Which parts of your community are thriving, and which are quiet.
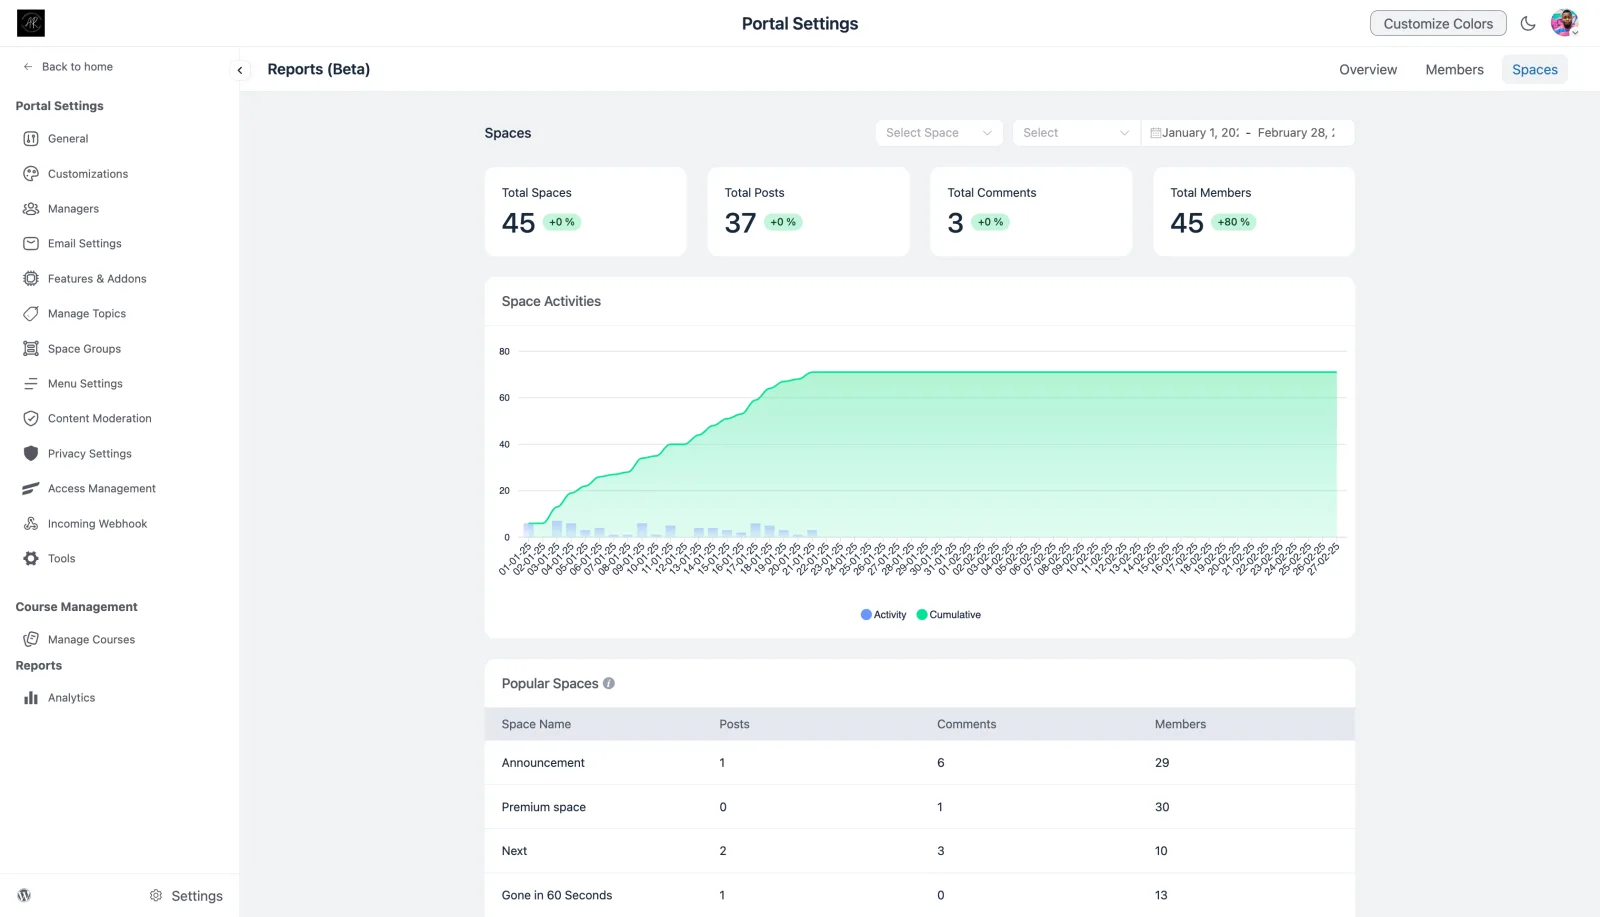
Stat cards. Total Spaces, Total Posts, Total Comments, and Total Members for the selected period — or for one space, if you picked one in the Select Space dropdown.
Space Activities chart. Activity bars plus the cumulative line, showing how space activity has built up over the range.
Popular Spaces table. A ranked breakdown with one row per space and columns for Space Name, Posts, Comments, and Members.
That last table is worth reading carefully. A space with plenty of members but almost no posts is not really working — it usually needs a prompt, a pinned discussion, or to be merged into a busier space. See Creating a New Space and Space Settings & Privacy for your options.
⚠️ Important: Analytics is labeled Reports (Beta). The layout and the available metrics may change in future FluentCommunity releases, so treat the numbers as directional insight rather than a permanent audit record.
Turning the Numbers Into Action
| What you see | What to try |
|---|---|
| New Members climbing, Active Members flat | People are arriving but not engaging — improve onboarding and your welcome post. |
| One time block dominates Popular day & time | Schedule announcements and new discussions for that window. |
| A few names own every leaderboard | Promote them to moderators, or use badges and points to pull more members in. |
| Several spaces with zero posts | Consolidate them, or seed each with a starter discussion. |
Check in on these reports on a regular rhythm — weekly or monthly — rather than daily. Community trends are slow, and a longer date range tells you far more than yesterday's numbers.